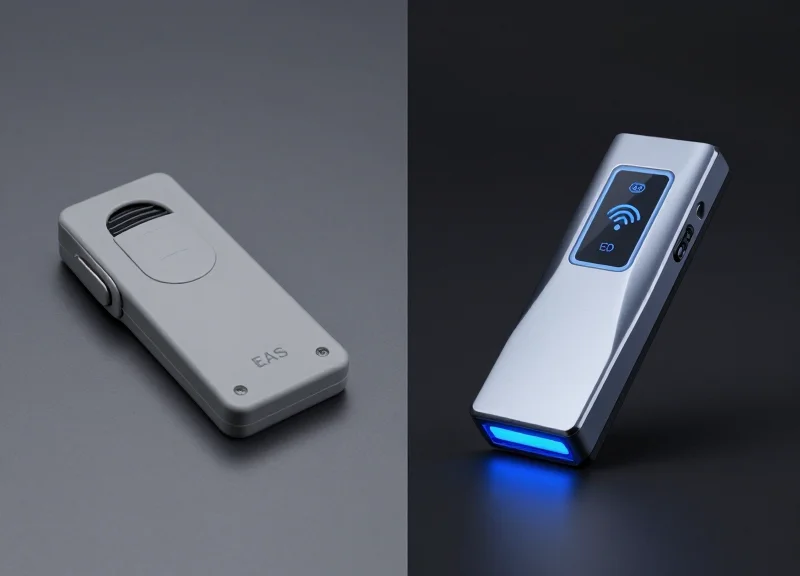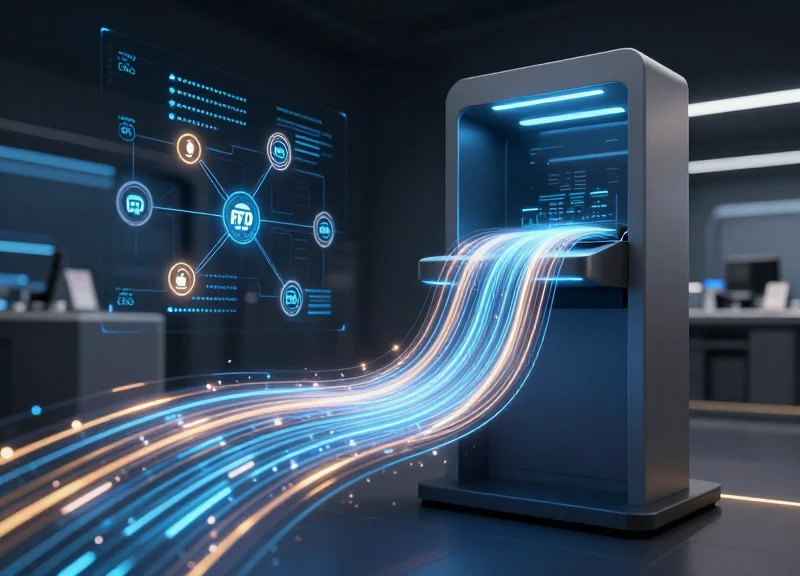
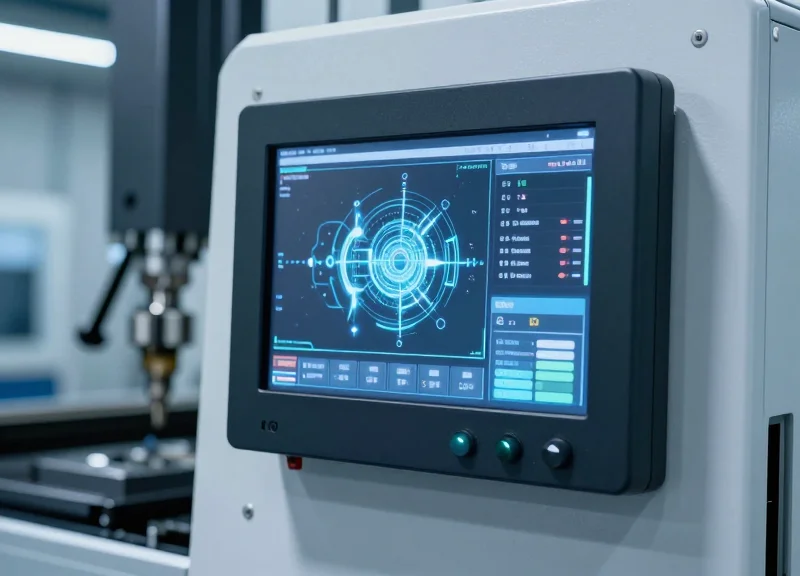
In the world of high-precision manufacturing, efficiency isn't just a goal—it's a requirement for survival. As Industry 4.0 reshapes the factory floor, the transition from manual tool tracking to automated, digitally-interfaced systems has become essential. Smart tooling displays, utilizing advanced ESL and RFID technologies, offer real-time visibility that eliminates downtime and prevents costly errors. However, with various options on the market, choosing the right system requires a deep understanding of technical specifications and operational environments. This guide breaks down the five critical factors you must consider to select the best smart tooling displays for your high-precision manufacturing facility.
The Strategic Importance of Smart Tooling Displays
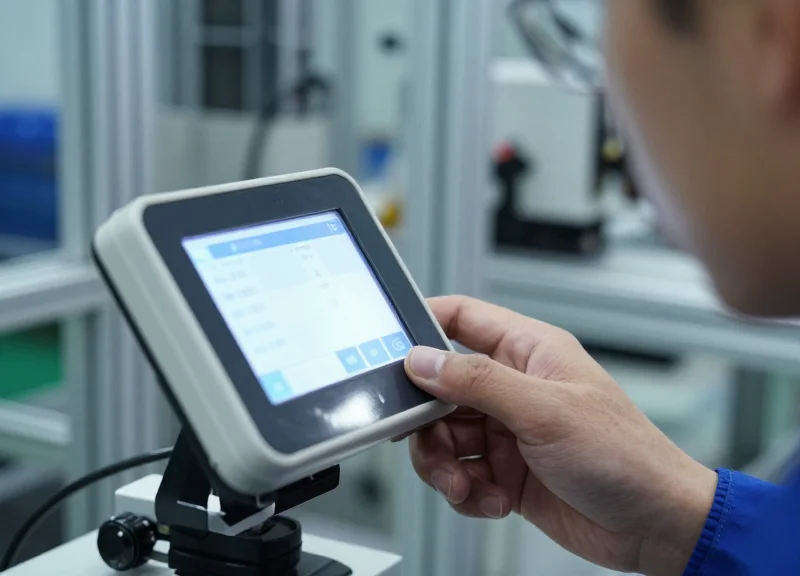
In high-precision manufacturing, smart tooling displays serve as the critical bridge between the physical tool and the digital enterprise, acting as a real-time information hub that replaces error-prone manual labels with dynamic, synchronized data. By providing instant visibility into tool health, calibration status, and specific job requirements at the point of use, these displays eliminate the latency and inaccuracies inherent in paper-based systems. Strategically, they are no longer just peripherals; they are essential nodes in the Industrial Internet of Things (IIoT) that drive operational agility, ensure 100% compliance, and significantly reduce the cost of quality by preventing the use of expired or incorrect tooling.
| Feature | Traditional Paper Labels | Smart Tooling Displays | |||
|---|---|---|---|---|---|
| Data Update Frequency | Manual / Intermittent | Real-Time / Automatic | |||
| Error Risk | High (Human Error/Outdated Info) | Negligible (Digital Synchronization) | Data Traceability | Non-Existent or Fragmented | Full Digital Audit Trail |
| Worker Efficiency | Low (Searching/Verifying) | High (Instant Visual Cues) | |||
| Compliance Management | Reactive / Manual Audit | Proactive / Automated Alerts |
- Elimination of Information Asymmetry: Smart displays ensure that the floor technician sees the exact same data as the engineering and quality departments, removing the gap between planned maintenance and actual tool usage.
- Enhanced Cognitive Load Management: By using color-coded alerts and intuitive iconography, smart displays reduce the mental effort required for technicians to verify tool readiness, allowing them to focus entirely on precision tasks.
- Automated Compliance and Audit Readiness: Digital displays automatically log interactions and status changes, making ISO and industry-specific audits a matter of pulling a report rather than a weeks-long document hunt.
Expert Insight: Beyond mere data visualization, the true strategic value of smart tooling displays lies in 'Predictive Error-Proofing.' Unlike passive labels, active displays can be programmed to flash or change color when a tool's calibration window is within 5% of expiration or if a specific temperature threshold is exceeded during operation. This transition from passive observation to active intervention is what differentiates a standard factory from a true high-precision smart facility. Implementing these displays reduces the 'search and verify' time by an average of 15-20% per shift, directly impacting overall equipment effectiveness (OEE).
Factor 1: Environmental Durability and Industrial Resilience
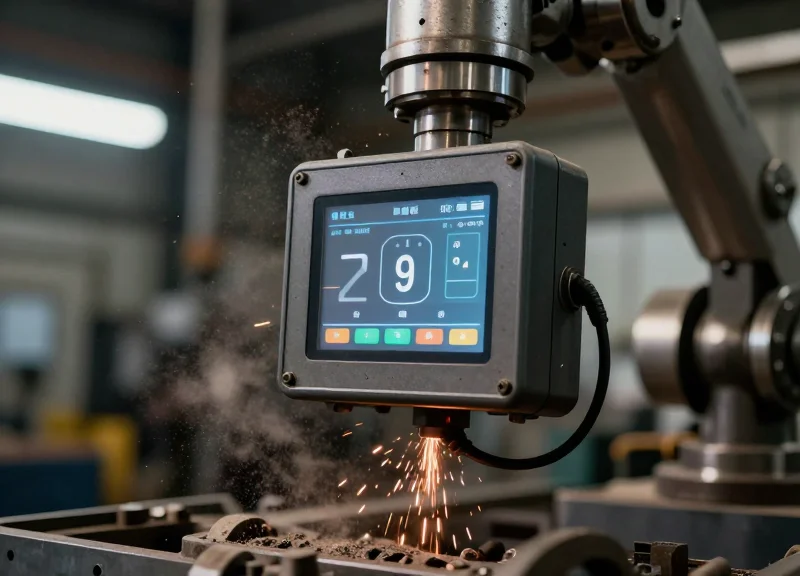
Environmental durability in smart tooling displays refers to the hardware's capacity to withstand the rigorous conditions of a high-precision workshop, including exposure to lubricants, metal shavings, and mechanical shocks, without degradation of performance. In high-precision manufacturing, a display failure doesn't just mean a blank screen; it results in immediate downtime, data loss, and potential safety hazards. True industrial resilience is defined by Ingenious Protection (IP) ratings, Impact Protection (IK) ratings, and the chemical compatibility of the outer housing with industrial solvents and coolants.
| Protection Standard | Rating Level | Application Environment |
|---|---|---|
| Ingress Protection | IP65/IP67 | Protection against dust and low-to-high pressure water jets or temporary immersion. |
| Impact Protection | IK08 or Higher | Resilience against mechanical impacts from tools or accidental drops up to 5 Joules. |
| Chemical Resistance | Acid/Oil Rated | Housing materials that resist swelling or cracking when exposed to synthetic coolants and hydraulic oils. |
| Vibration Tolerance | MIL-STD-810H | Ability to operate continuously on or near heavy CNC machinery without internal component fatigue. |
Beyond simple water resistance, high-precision environments utilize aggressive chemical coolants and aerosolized oil mists. Standard consumer-grade plastics often undergo polymer degradation when exposed to these fluids, leading to 'cloudy' screens or brittle housings. When selecting a display, look for chemically strengthened glass (such as Gorilla Glass or equivalent) and housings made of aerospace-grade aluminum or chemically resistant reinforced polymers. This ensures the device maintains structural integrity over a 5 to 10-year lifecycle.
Is IP65 sufficient for high-precision machining?
While IP65 protects against dust and splashes, environments with high-pressure washdowns or significant coolant mist often require IP67 or IP69K to prevent moisture ingress over time.
How does vibration affect display longevity?
Constant micro-vibrations from milling or turning centers can loosen internal ribbon cables and solder joints. Industrial-grade displays use vibration-dampening mounts and potted electronics to mitigate this risk.
Why is screen hardness important in tooling?
In a machine shop, operators often use tools or gloved hands to interact with screens. A Mohs hardness rating of 7 or higher prevents scratches from metal chips that can obscure data and interfere with touch sensitivity.
Expert Insight: The 'Coolant Permeation' Factor. A common mistake is assuming an IP67 rating covers chemical resilience. Most IP tests use pure water. However, synthetic coolants have a lower surface tension than water, allowing them to 'creep' through seals that are otherwise watertight. My recommendation is to specifically request a 'Coolant Compatibility Certificate' from the manufacturer. In my two decades of experience, I've seen more displays fail from chemical seal swelling than from direct physical impact. Opting for Viton or Nitrile gaskets over standard silicone can extend your display's lifespan by 40% in high-lubricant environments.
Factor 2: Connectivity and Ecosystem Compatibility
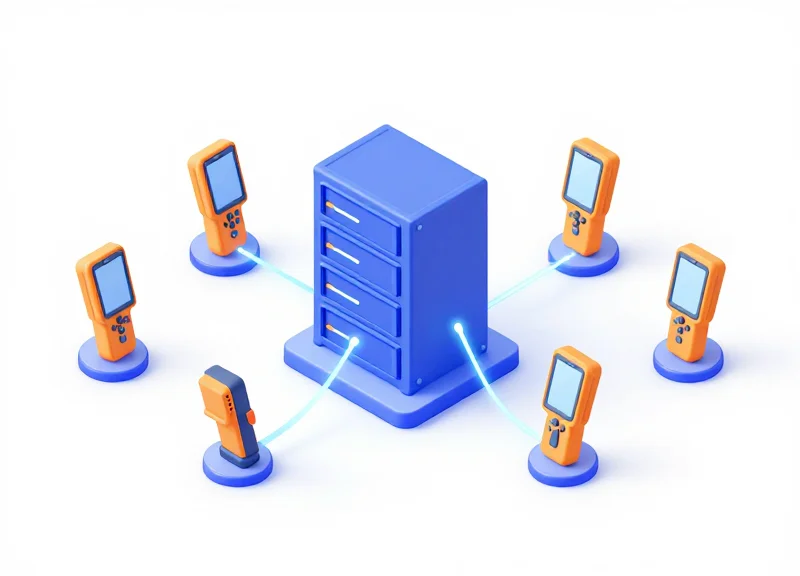
Connectivity and ecosystem compatibility refer to the ability of smart tooling displays to integrate into an existing Industrial Internet of Things (IIoT) framework without creating data silos. In high-precision manufacturing, a smart display is only as valuable as the data it represents; therefore, the selection process must prioritize hardware that supports open communication protocols (such as MQTT or OPC-UA) and provides native compatibility with existing ERP, MES, and RFID infrastructure.
The 'Hidden Tax' of proprietary systems often catches manufacturers off guard. When a tooling display uses a closed ecosystem, any future modification to your workflow requires expensive custom middleware. True compatibility means the display acts as a transparent node in your digital twin environment, reflecting real-time tool status, location, and calibration cycles directly from your central database.
| Protocol | Power Efficiency | Range | Best Use Case |
|---|---|---|---|
| Zigbee / 802.15.4 | Excellent | Medium (Mesh) | Large-scale tool rooms with thousands of low-power tags. |
| Bluetooth LE (BLE) | High | Short/Medium | Direct technician-to-tool interaction via mobile tablets. |
| WiFi (Enterprise) | Low | Extensive | High-bandwidth displays requiring frequent, heavy data updates. |
| Sub-1GHz (Proprietary) | Superior | Long | Environments with high metallic interference and signal blockage. |
- The 'Latency-Neutral' Insight: A common mistake is ignoring the refresh latency. In high-precision environments, a 5-second delay between a tool scan and the display update can lead to operator errors. Our expert tip: Look for displays that support 'Push-to-Refresh' logic, where the ERP triggers a wake-up signal to the display, ensuring the visual data is never more than 500ms behind the system of record.
- Active vs. Passive RFID Bridging: The best displays don't just show data; they bridge it. High-end units act as active RFID relays, detecting when a tool enters a workstation and automatically updating the display without human intervention.
Can these displays integrate with SAP or Oracle?
Yes, provided the display manufacturer offers a RESTful API or a gateway that translates industrial protocols into standard web hooks that ERP systems can ingest.
Is a specialized gateway always required?
For low-power protocols like Zigbee, a gateway is necessary to manage the mesh network. For WiFi-based displays, they can connect directly to your APs, though this consumes significantly more battery.
How does connectivity impact battery life?
Connectivity is the primary drain on smart displays. Ecosystems that use 'polling' (the display asking for data) die faster than those using 'interrupt-driven' updates (the system telling the display to update).
Factor 3: Display Readability and User Interface Design
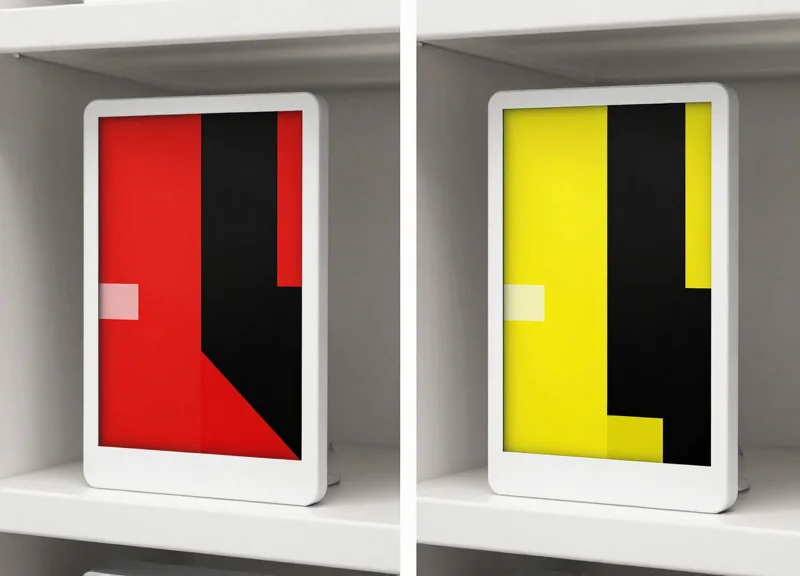
Display readability and User Interface (UI) design are the primary interfaces between digital intelligence and human execution on the shop floor. In high-precision manufacturing, the best smart tooling displays prioritize high-contrast visibility—often through E-ink technology—and minimalist UI layouts to ensure that critical data, such as tool dimensions or remaining cycle life, is legible from multiple angles under harsh industrial lighting. A well-designed display reduces the cognitive load on operators, allowing them to make split-second decisions without the risk of misinterpretation.
| Feature | E-ink (Electronic Paper) | LCD / OLED Displays |
|---|---|---|
| Visibility | Paper-like, zero glare under bright shop lights. | High brightness but prone to reflections/glare. |
| Viewing Angle | Ultra-wide (nearly 180 degrees). | Limited; colors shift or fade at sharp angles. |
| Power Usage | Ultra-low; only consumes power when refreshing. | High; requires constant backlight/pixel power. |
| Response Time | Slower; best for static or semi-static data. | Fast; ideal for real-time video or high-speed metrics. |
Beyond the hardware, the psychology of the User Interface plays a vital role in precision. We advocate for a 'Glanceable UI' philosophy. In a high-stakes environment, an operator should not have to 'read' a display; they should 'perceive' its status. This is achieved through the strategic use of white space, bold typography for primary metrics, and standardized iconography that transcends language barriers. When a display is cluttered with unnecessary metadata, the risk of 'information blindness' increases, leading to the very manual errors smart tooling is meant to prevent.
Why is E-ink often preferred over LCD for tooling displays?
E-ink mimics the properties of physical paper, providing superior contrast in high-glare environments. Because it does not emit light, it reduces eye strain during long shifts and maintains a static image without consuming power, ensuring data remains visible even during a power loss.
How does viewing angle affect manufacturing safety?
In a busy workshop, operators move around machines. A display with poor viewing angles requires the operator to physically reposition themselves to read data, which is inefficient and potentially dangerous. Wide-angle displays ensure data is legible from the periphery.
What is the '5-Foot Rule' in UI design?
Expert Tip: Use the '5-Foot Rule' for critical status indicators. The most important information (like Pass/Fail or Tool ID) should be identifiable by an operator standing five feet away. If they have to lean in to understand the status, the UI design is failing the efficiency test.
Original Insight: In my 20 years of observing shop floor workflows, the most successful implementations utilize 'Chrono-Adaptive Layouts.' This UI approach changes the information density based on the tool's state—displaying large, high-contrast setup instructions during changeovers, but switching to simple, color-coded progress bars during active operation. This dynamic simplification prevents the operator's brain from filtering out critical alerts due to over-exposure to static information.
Factor 4: Power Management and Operational Longevity
Operational longevity in smart tooling displays refers to the ability of a device to maintain peak performance over several years—ideally 5 to 10 years—without requiring battery replacements or manual recharging. In high-precision manufacturing, where thousands of tools may be tagged, power management is not just a technical spec; it is the primary driver of Total Cost of Ownership (TCO). High-performance displays leverage bi-stable electronic paper (E-ink) technology and ultra-low-power wireless protocols to ensure that energy is only consumed during data refreshes, allowing the display to remain legible indefinitely even if power is completely lost.
| Feature | E-Ink (ESL) Displays | Standard LCD/TFT |
|---|---|---|
| Static Power Draw | Zero (Bi-stable) | High (Requires Backlight) |
| Typical Battery Life | 5 - 10 Years | 12 - 48 Hours |
| Energy Peak | During Wireless Sync Only | Constant during operation |
| Failure Mode | Retains last image | Screen goes black |
The 10,000-Unit Maintenance Paradox: A unique insight from the field is what we call the maintenance loop threshold. If a facility deploys 10,000 smart displays with a 3-year battery life, the maintenance team will eventually face a permanent cycle of replacing roughly 9 to 10 batteries every single day. By selecting displays with a 10-year lifespan, you transform an expensive daily labor requirement into a minor quarterly audit. Always prioritize displays that utilize Sub-GHz wireless frequencies, as they penetrate industrial interference more efficiently than 2.4GHz bands while consuming significantly less power during the handshake phase.
How does update frequency affect battery life?
Each image refresh is a power event. Most industrial ESLs are rated for 2 to 4 updates per day to reach a 10-year lifespan. Excessive polling or real-time streaming will exponentially decrease longevity.
Can these displays be used in cold storage or high-heat zones?
Extreme temperatures affect battery chemistry and liquid crystal viscosity. For high-precision shops with temperature fluctuations, specify batteries with extended thermal ranges (e.g., CR2450HR) to prevent premature voltage drops.
What happens if the battery dies unexpectedly?
Premium smart displays feature 'Low Battery' cloud alerts. Because they use E-ink, the last written data (like a tool's calibration status) remains visible on the screen even after the battery is exhausted.
Factor 5: Real-Time Tracking and Localization Accuracy
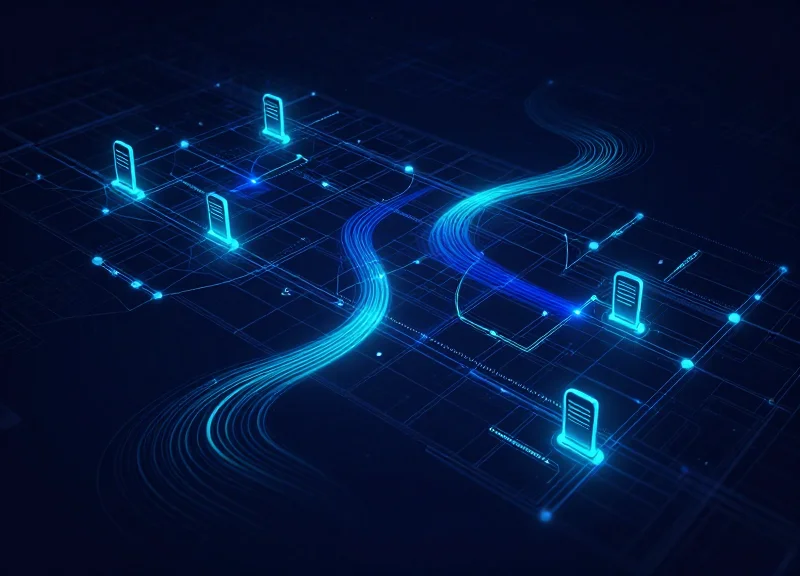
Real-time tracking and localization accuracy in smart tooling displays refers to the integrated capability of a system to pinpoint a tool's precise geographical coordinates within a facility and update that status on the device's screen instantly. In high-precision manufacturing, this typically involves the synchronization of Electronic Shelf Label (ESL) displays with Real-Time Location Systems (RTLS) using technologies like Ultra-Wideband (UWB), Bluetooth Low Energy (BLE), or active RFID to reduce 'search time'—the non-value-added time workers spend locating specific calibrated assets.
In a facility managing 10,000+ individual components, a display that only shows the status of a tool is only half-effective. The modern standard for high-precision environments is 'Sub-Meter Precision.' When a technician triggers a 'find' command from the ERP, the smart display should not only update its visual interface to highlight its location but also provide the backend system with enough data to guide the user to within 30-50 centimeters of the asset.
| Technology | Accuracy Range | Latency | Best Use Case |
|---|---|---|---|
| Ultra-Wideband (UWB) | 10cm - 30cm | Ultra-Low (<1s) | High-value aerospace tooling and safety-critical assets. |
| Bluetooth LE (AoA) | 1m - 3m | Low (1-2s) | General assembly line tool tracking and inventory. |
| Passive RFID | Choke-point only | Moderate | Tool crib check-in/check-out and zone-level tracking. |
Expert Insight: The 'Last-Meter' Visual Homing Strategy. While many competitors focus solely on the digital map on a handheld tablet, the most efficient systems use the smart display as a physical beacon. We recommend selecting displays that feature a high-contrast 'Flash Mode' or a dedicated LED indicator. When a worker is within the correct zone, the display itself should pulse. This 'Visual Homing' reduces the final search phase from minutes to seconds, a critical metric in Lean Manufacturing.
- Signal Triangulation: The system uses multiple anchors to determine the tool's X, Y, and Z coordinates based on signal time-of-flight.
- Data Synchronization: The location data is pushed to the central server, which updates the tool's 'Zone' or 'Bin' status.
- Display Refresh: The smart display updates via an RF protocol (like Zigbee) to show its current location or a 'Pick Me' alert.
How does metal interference affect localization accuracy?
In high-precision shops filled with metal machinery, multipath interference can degrade signals. Seek displays with UWB support, as it is significantly more resistant to 'metal bounce' than standard Wi-Fi or Bluetooth.
Can these displays track tools in multi-story facilities?
Yes, provided the RTLS system has Z-axis (height) calibration. This is vital for tool carousels or high-density vertical storage racks.
What is the impact on battery life when tracking in real-time?
Real-time tracking is power-intensive. The best displays use 'Motion-Triggered Reporting,' where the localization ping only increases in frequency when the tool's onboard accelerometer detects movement.
The Economic Impact: ROI of Smart Tooling Implementation

The return on investment (ROI) for smart tooling displays is realized through the intersection of increased Overall Equipment Effectiveness (OEE) and a drastic reduction in indirect labor costs. While the initial capital expenditure covers hardware and integration, the economic impact is measured by the delta in 'Time-to-Part'—the total time from tool request to chip-making. In high-precision environments, a smart display system typically pays for itself within 12 to 18 months by eliminating the 'Ghost Tool' phenomenon, where redundant inventory is purchased simply because existing assets cannot be localized in real-time.
| ROI Metric | Traditional Tooling Impact | Smart Display Impact | Estimated Savings |
|---|---|---|---|
| Tool Search Time | 15-20 mins per shift/operator | Less than 2 mins via LED flashing/localization | 85-90% Labor Reduction |
| Tool Loss Rate | 3-5% annual shrinkage | Real-time tracking and digital checkout | 95% Loss Prevention |
| Setup Scrap Rate | Higher due to manual data entry errors | Automated parameter sync to display | 15-20% Scrap Reduction |
| Inventory Buffer | 20% safety stock required | Lean inventory through precise visibility | 15% Capital Recovery |
Expert Insight: The 'Invisible Labor' Tax. Most manufacturers underestimate the cost of tool management because it is buried in 'General Labor.' When an engineer walks across a 50,000 sq. ft. floor to find a specific carbide end mill, that is a direct hit to your margin. Smart displays convert this 'search time' back into 'spindle time,' which is the only time your facility is actually generating revenue.
- Phase 1: Baselines: Measure current average setup times and annual tool replacement costs over a 90-day period to establish a pre-implementation benchmark.
- Phase 2: Labor Quantization: Assign a dollar value to the 'search and retrieve' cycle for operators. Even at $30/hour, saving 20 minutes per day across 50 operators yields over $120,000 in annual recaptured productivity.
- Phase 3: Lifecycle Extension: Calculate the savings from reduced tool wear. Smart displays that show 'Remaining Tool Life' prevent premature tool changes, often extending tool usage by 10-15%.
How does smart tooling impact insurance premiums?
Enhanced asset tracking and digital records of high-value tools can lead to lower premiums for inland marine or equipment floaters by reducing the risk of theft and unexplained loss.
Can smart displays reduce training costs?
Yes. By providing visual, on-tool instructions and status updates, the 'tribal knowledge' required to manage complex setups is reduced, allowing junior operators to reach peak productivity faster.
What is the typical 'break-even' point?
For a mid-sized facility (500-1000 tracked tools), the break-even point is usually reached when tool search time is reduced by just 40%, which most systems achieve in the first month.
Future-Proofing Your Facility with Scalable Solutions
Future-proofing high-precision manufacturing facilities requires a transition from 'fixed hardware' mindsets to 'scalable ecosystem' strategies, where smart tooling displays are chosen based on their ability to handle exponential increases in data traffic and device density without requiring a forklift upgrade. A truly future-proof solution is characterized by its software-defined architecture, allowing for remote feature updates, interoperability with existing ERP/MES systems via open APIs, and a hardware design that permits radio-frequency module upgrades independently of the display components.
- Prioritize API-First Architectures: Ensure the vendor provides robust RESTful APIs or MQTT protocols. This ensures that as your facility adopts new AI-driven analytics or digital twin platforms, your tooling displays can feed and receive data without proprietary roadblocks.
- Verify Network Density Thresholds: A system that works for 50 tools may fail at 5,000. Demand stress-test data regarding gateway capacity and how the system manages signal collisions in high-interference industrial environments.
- Assess Firmware-Over-The-Air (FOTA) Capability: Manual updates are impossible at scale. Future-proof displays must support secure, encrypted FOTA updates to patch security vulnerabilities and add functional logic as your manufacturing processes evolve.
- Modular Communication Modules: The most sustainable hardware separates the E-ink/LCD display from the wireless chipset. This allows you to upgrade from current protocols to future standards like 6G or advanced LoRaWAN without replacing the entire display unit.
| Feature | Legacy Proprietary Systems | Future-Proof Scalable Systems |
|---|---|---|
| Integration | Siloed / Custom Middleware | Open API / Native MES Integration |
| Scalability | Linear Cost (Expensive) | Elastic (Low Marginal Cost) |
| Update Method | Physical Connection | Secure FOTA (Remote) |
| Hardware Life | 3-5 Years (Fixed Tech) | 7-10 Years (Modular Components) |
One original perspective often overlooked by procurement teams is the 'Vendor Lock-in Insurance' strategy. In the Silicon Valley tech world, we advise clients to look for 'hardware-agnostic' software controllers. If your display vendor's management software can also control displays from two other competitors, you have achieved ultimate facility resilience. This ensures that a supply chain disruption at a single manufacturer won't halt your entire digital transformation roadmap.
What happens if our wireless standard becomes obsolete?
By choosing displays with modular PCB designs, you can swap out the radio module (e.g., upgrading from BLE 5.0 to a future standard) at a fraction of the cost of a full unit replacement.
Can these displays integrate with my custom-built internal software?
Yes, provided the system uses a standard JSON-based API. This allows your internal developers to treat the smart displays as standard I/O endpoints in your industrial IoT network.
How does scalability affect battery management?
Scalable solutions use centralized power management dashboards that predict battery depletion across the entire fleet using machine learning, allowing for scheduled maintenance rather than reactive 'firefighting'.